Dashboard
When building a proposed plan RPS extends same page control so you never have to leave the page when making recommendation.
Much like the current plan the proposed plan has three sections that include: low risk/short-term assets, baseline income and high risk/long-term assets. Question boxes can be found that define each section and the types of investments to consider for that section.
Your client’s retirement goals are summarized at the bottom of each section and current assets contributing to the target are at the top.
Buckets illustrate whether values are over-weighted, under-weighted or right on track with target amounts.
EXAMPLE: An under-weighted bucket in the baseline income section represents the need to increase the probable income to products producing guaranteed income that will accomplish hitting the client’s stated target.
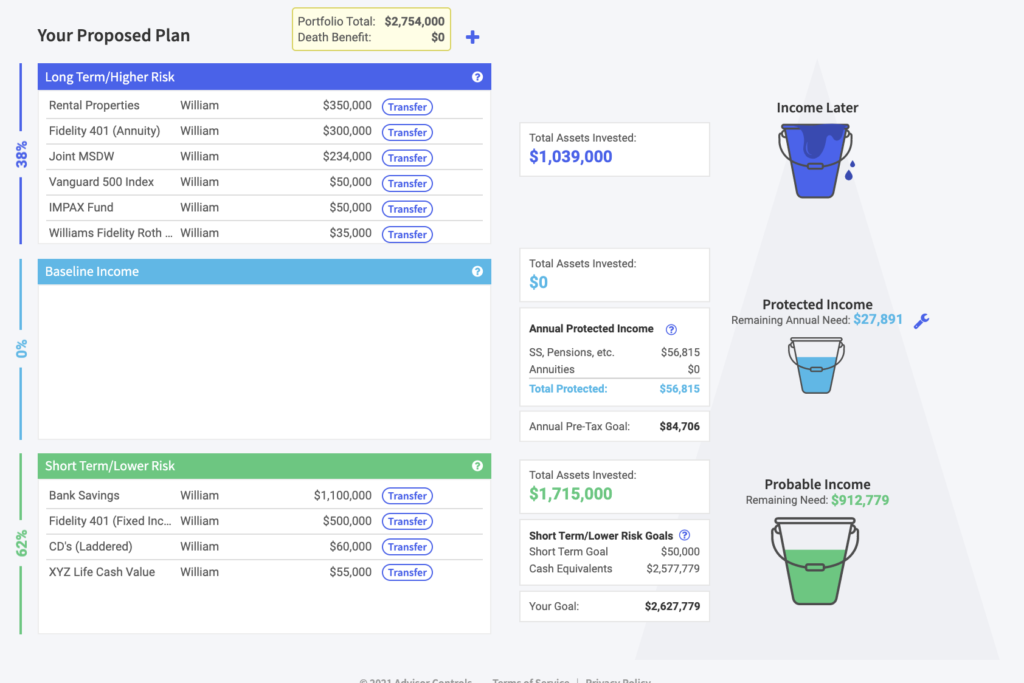
Annual protected income
The annual protected income value reflects the total of all guaranteed Pre-Tax income sources taken from the highest point at which income begins. Short-term/Low Risk assets support income needs when a guaranteed income shortfall exists, or taxes need to be paid. Note: only annuity products that provide guaranteed income for life (to age 100) are included for baseline/protected income calculations.
Tips for entering assets
When you click on the transfer button you will be able to create a full or partial transfer of an asset to a new or existing position. This allows a seamless move from assets to recommendations, thus filling the Protected (middle/blue) & Probable (bottom/green) income buckets to desired levels.
You are also able to hover over each coded recommendation to see more detail on the transaction such as where the money moved from, where it is going, corresponding notes and what number recommendation it was.
Tip for Entering Assets: To properly allocate assets to their appropriate Bucket Strategy, separate asset types (Equity, Bonds, Cash, Annuities with Income Riders, Annuities without Income Riders) found on each statement. Buckets define the role each asset plays in a retirement plan. Individual entries will be made for each asset type as follows:
Sample Asset Description:
Fidelity IRA (Cash) This will drop into the bottom bucket (short-term/low risk).
Fidelity IRA (Bond) Fidelity IRA (Equity) This will drop into the bottom bucket (short-term/low risk)
Fidelity IRA (Equity) This will drop into the top bucket (long-term/high risk).
AXA (Annuity with Income Rider) This will drop into the middle bucket (baseline guaranteed income)
Proposed cash flow
This section illustrates both Protected and Probable income sources in the Proposed Plan used to meet the total annual income need. Dials are used to simulate retirement risks and solutions to income shortfalls. Solid lines over the graph illustrate available protected income relative to desired protected income. The addition of baseline guaranteed income products closes the gap between the two lines.
Note: Clicking on the graph or the ledger will display inflation and tax adjusted income sources.
Proposed liquid asset drawdown
This section illustrates the effect withdrawals, contributions and growth rate assumptions, have on each asset class and total net worth within the Proposed Plan.
Proposed allocation
This section illustrates cash, fixed income and equity buckets used to meet the income need in the proposed plan. This can be useful for understanding how low risk liquid assets help to meet the income target, above what protected income sources are providing, as well as providing a gauge for replenishing values in a client review. The assumed annual growth rate on cash is 1% and fixed income is 2%.
Note: clicking the arrows will simulate hypothetical bucket values.
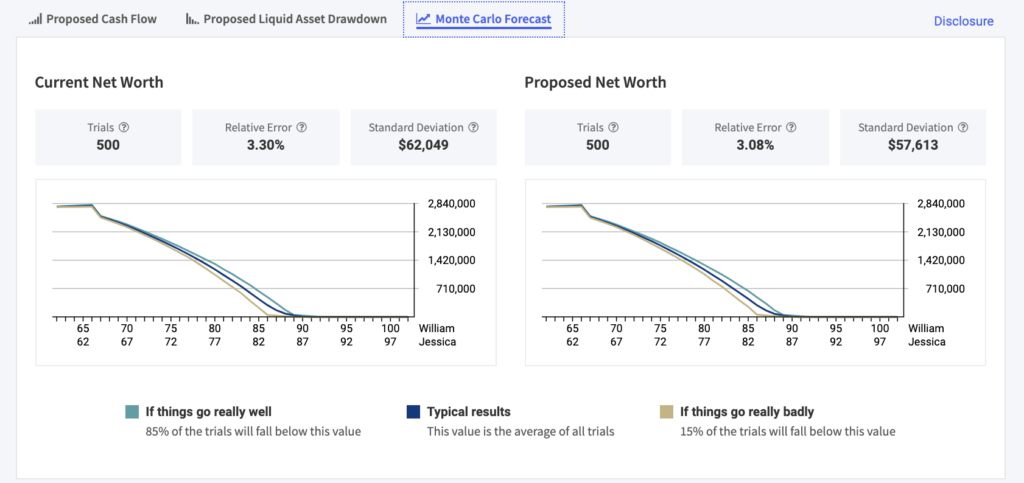
Monte Carlo forecast
Monte Carlo simulations statistically support improved portfolio value.
Trials: a trial is one simulation of results, based on how much you save for retirement, how long you save, and the rate of return associated with your risk tolerance level.
Relative Error: relative error is expressed as a percent and is useful to determine how close an approximation is to the true quantity being measured. The smaller the relative error, the closer to the true value.
Standard Deviation: standard deviation is a statistic that tells you how tightly all the various trials are clustered around the average in a set of data.