Cash sources
Clicking on the graph or the ledger will display inflation and tax adjusted income sources.
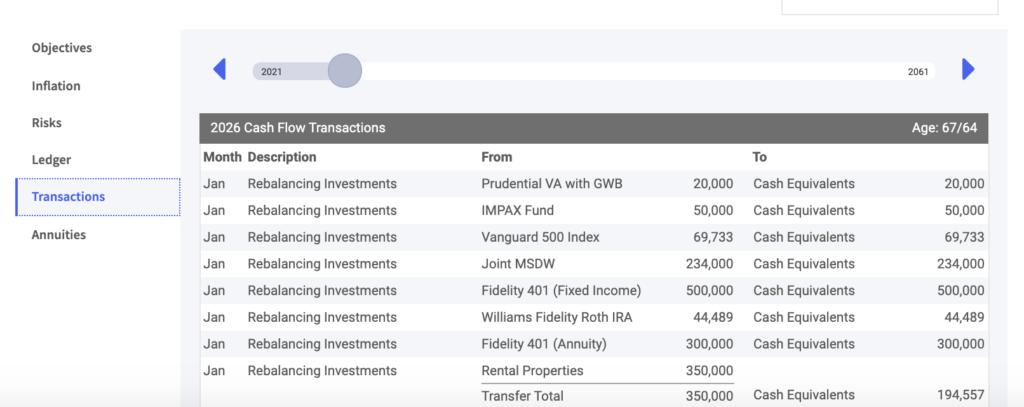
If more detail is needed you can find the color-coded ledger which provides detailed monthly values forecasting through age 100.
At Risk Income: Available income and withdrawals from assets that are considered to be at risk. The Salary & Other Income column shows all available non-guaranteed income. The Low Risk Assets and High-Risk Assets columns will show income withdrawals from non-guaranteed annuities as well as any asset withdrawals needed to fulfill the retirement income plus taxes incurred each year.
Dials
Within RPS dials are used to simulate retirement risks and solutions to income shortfalls and allow you to quickly illustrate the effect retirement risks have on cash flow or portfolio assets.
Simulation dials can be found under objectives, inflation, longevity and transactions on the left- hand side of the current cash flow page.

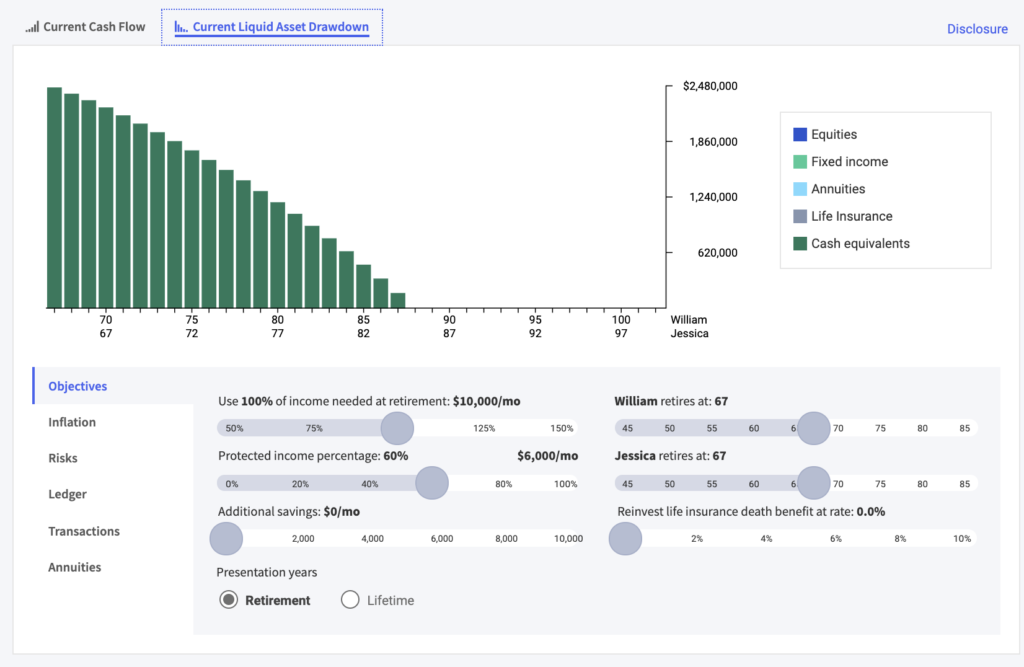
Current liquid asset drawdown
This section illustrates the effect withdrawals, contributions and growth rate assumptions, have on each asset class and total net worth within the Current Plan.
Note: Clicking on the graph or the ledger will display inflation and tax adjusted income sources.
Current allocation
This section illustrates cash, fixed income and equity buckets used to meet the income need in the Current Plan. The assumed annual growth rate on cash is 1% and fixed income is 2%.
Note: clicking the arrows will simulate hypothetical bucket values.