Your Summary Analysis
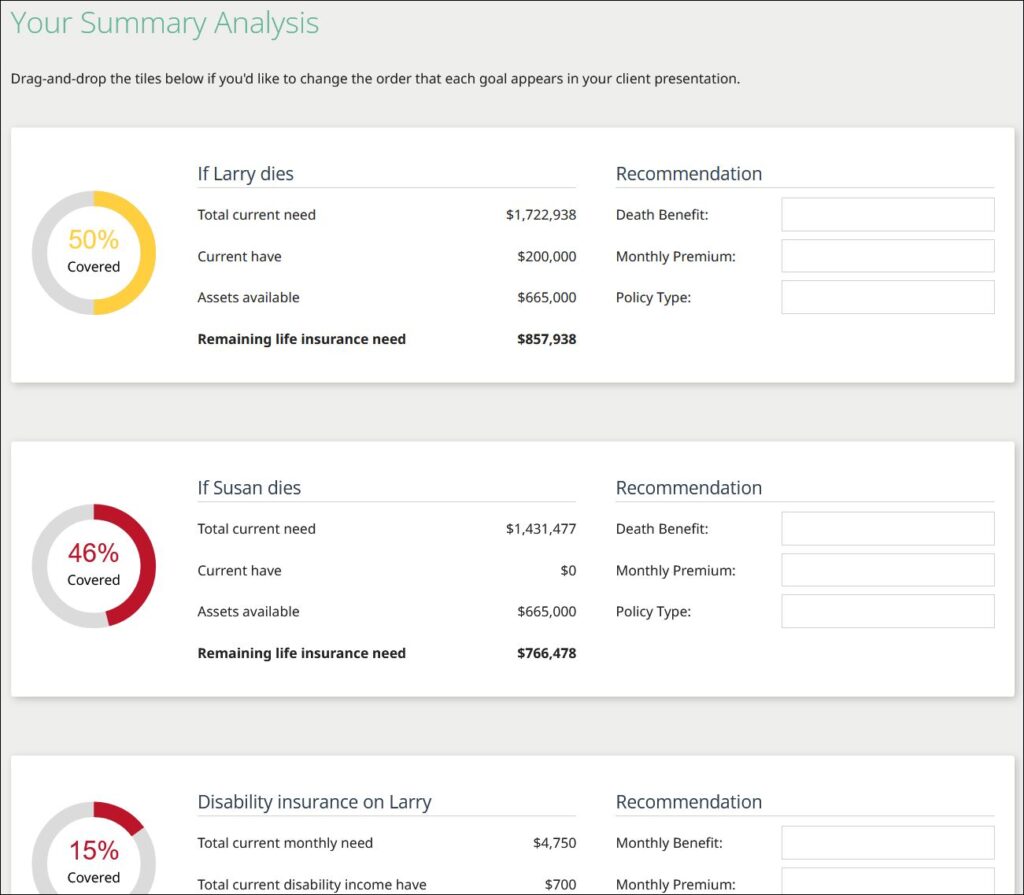
The “Your Summary Analysis” tab is the summation of all previous information entered. In this section you are presented with a percentage of achievement towards the goals your clients want to reach. This analysis allows you to make suggestions based on where your clients are doing well and where they are lacking in terms of their financial planning.
Your Summary Analysis has Goal Progress pie charts for each of the Modules in the presentation. For Survivor, Disability and Long-Term Care, if presenting for a married couple, you will see a Goal Progress pie chart for Client A and for Client B. Other pie charts are for Emergency Fund, Debt Management, Retirement and Education.
Recommendation: There are input fields for various recommendations. Recommendations typed here will appear on Your Summary Analysis page in the printed presentation.
Change the Order – In the software, you can drag and drop the tiles if you want to change the order goals appear on this page. The order here is the same order they will appears in the printed presentation.