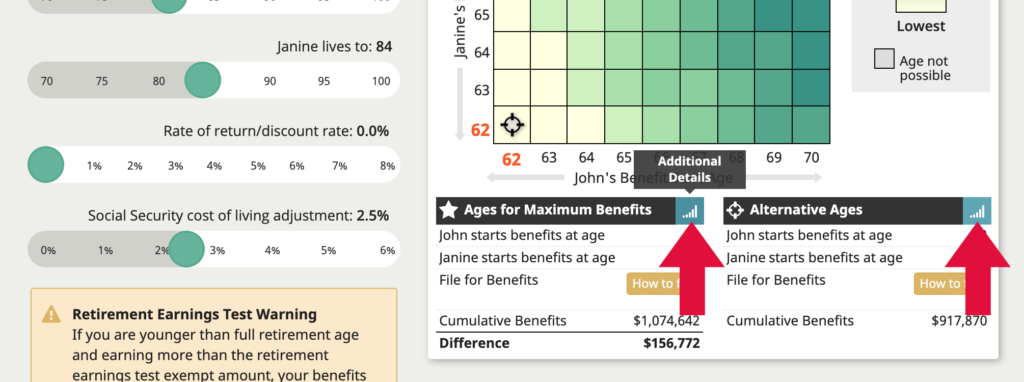
View additional graphs and ledgers
Click the blue graph icon to view additional graphs and ledgers for the maximum benefit start ages, or the selected alternative start ages. This will open a dialog containing an annual benefits by year graph with monthly benefit details, a benefit comparison ledger, a break-even graph, and an income taxation ledger.
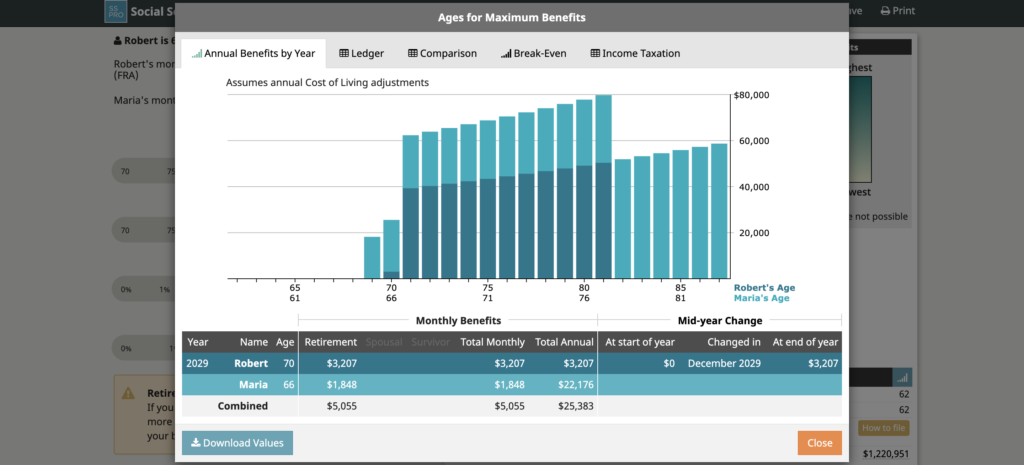
View annual and monthly benefits by year
Click either blue graph symbol below the interactive grid, to view the annual benefits by year graph for the maximum benefit ages or alternative start ages.
Hover over any bar on the graph to see get a complete look at monthly benefits and when the benefits would change due to steps in the filing method. This detailed breakdown appears directly below the graph.
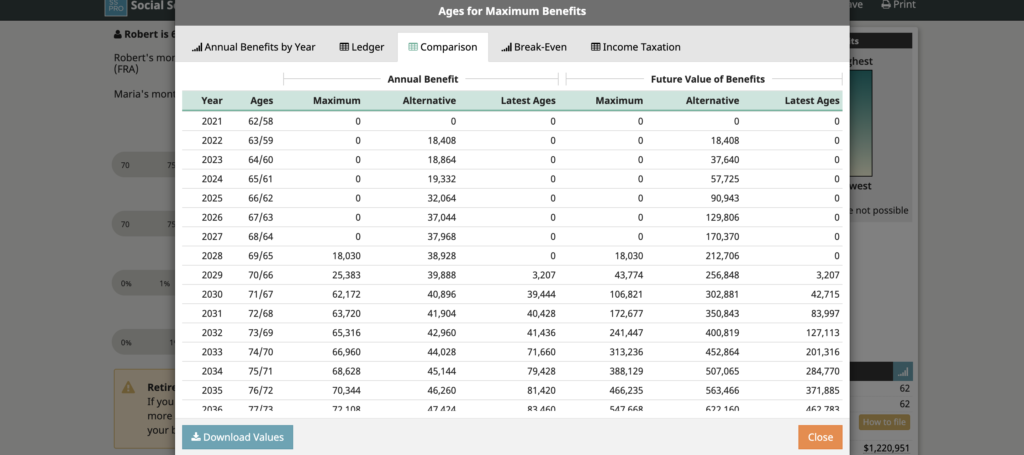
View comparison Ledger
Click either blue graph symbol below the interactive grid to open the additional details dialog for the maximum benefit ages or alternative start ages.
Once the dialog opens, click the comparison tab to view a ledger of annual benefits and cumulative benefits for the optimal ages, alternative ages, and starting as early as possible and at age 70.
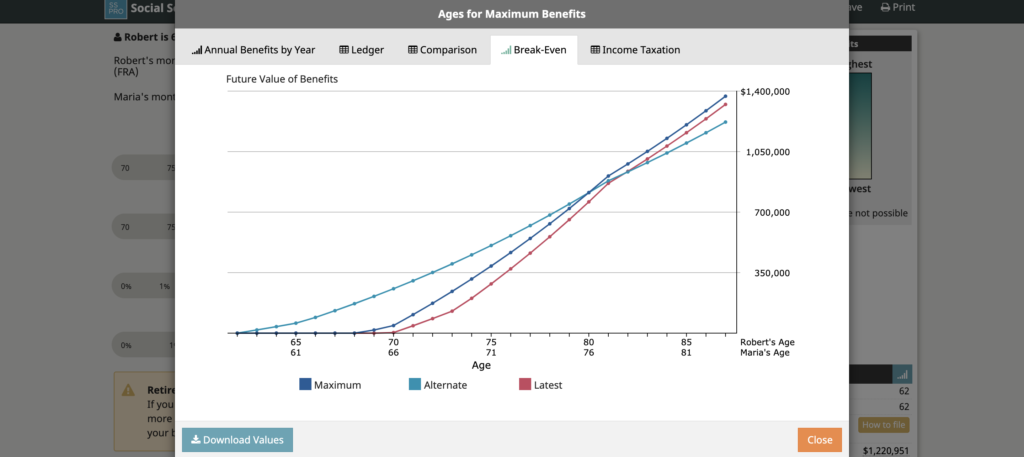
Break-even graph
Click either blue graph symbol below the interactive grid to open the additional details dialog for the maximum benefit ages or alternative start ages.
Once the dialog opens, click the break-even tab to view line graphs for the comparison values plus “Latest” filing alternative.
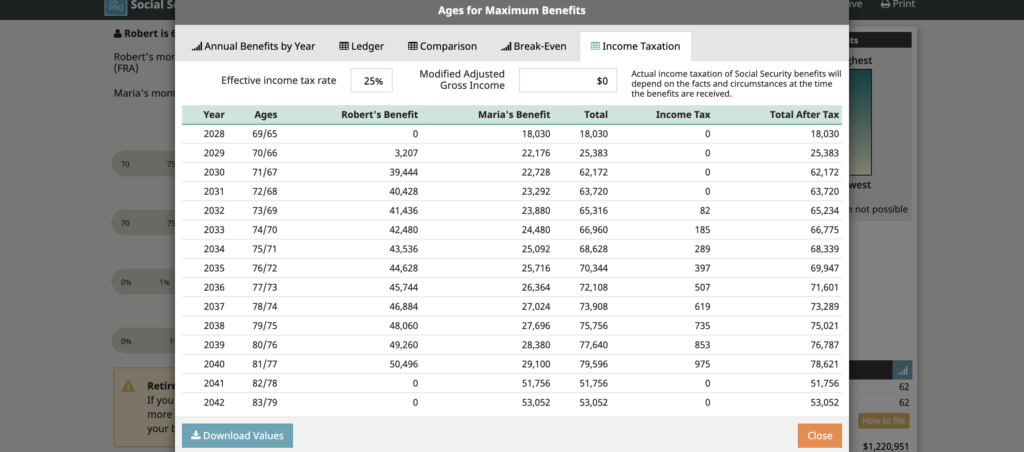
Income taxation ledger
Click either blue graph symbol below the interactive grid to open the additional details dialog for the maximum benefit ages or alternative start ages.
Once the dialog opens, click the income taxation tab, which includes inputs for an effective income tax rate and an assumption for modified adjusted gross income, and displays benefit totals before assumed tax, the amount of tax, and total after tax.